Project Requirements & Technical Info
Requirements
There are two primary objectives with the Real-Time Drilling Projects:
- Create a semi real-time data pipeline to transfer data from EDR providers into an in-house database in the company’s data lake. Data from an active well (currently being drilled) is then displayed on a Power BI dashboard for comparison against a historical well.
- Create a backfill mechanism for drilling engineers to backfill the database with historical wells that were not ingested properly or were drilled before the deployment of the data pipeline.
System Capacity
The system should support current and near-future drilling operations of ARC Resources, with up to 15 drilling rigs running concurrently. It should support up to 20 stacks of data (one per rig, up to 75 channels at 1s resolution) and up to 30 concurrent users with minimal performance impact.
Access to Dashboard & Data Connection
- Control access to the Parameters Comparison dashboard is provided by the drilling team, facilitated by IT.
- Data in the database should be available via the Data Access Layer (DAL). Details on accessing the data are in the Products » Drilling Database section below.
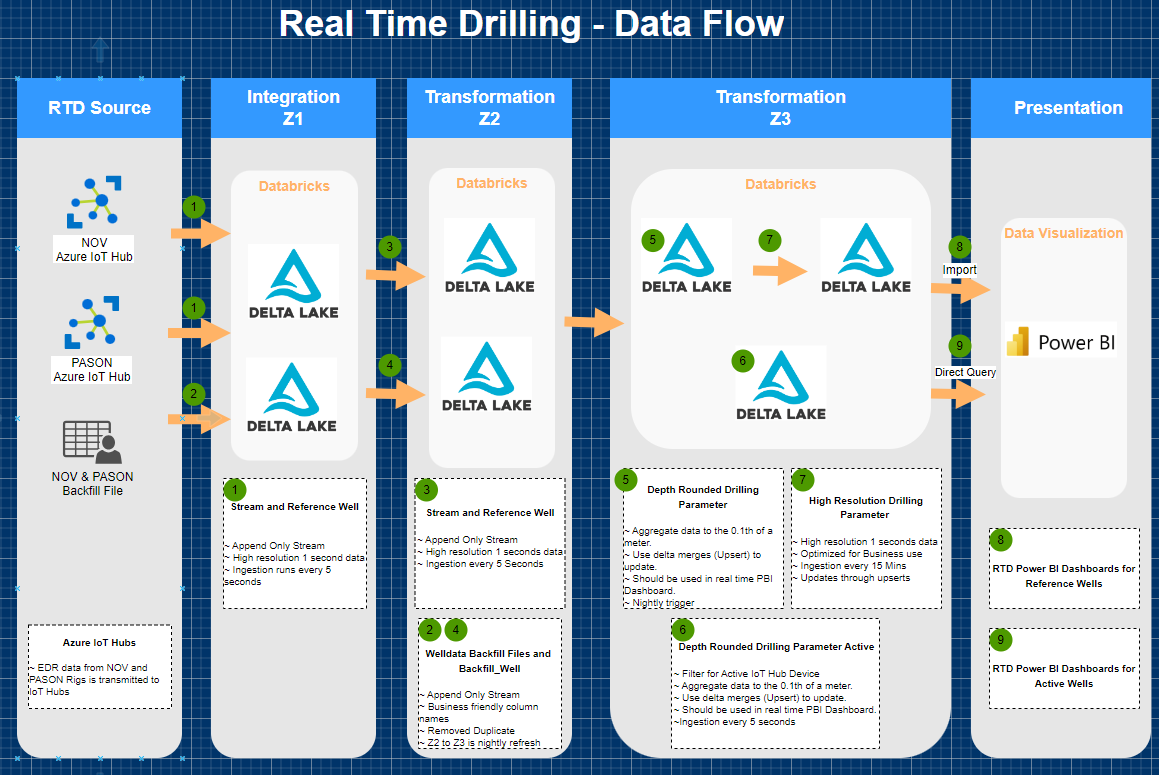
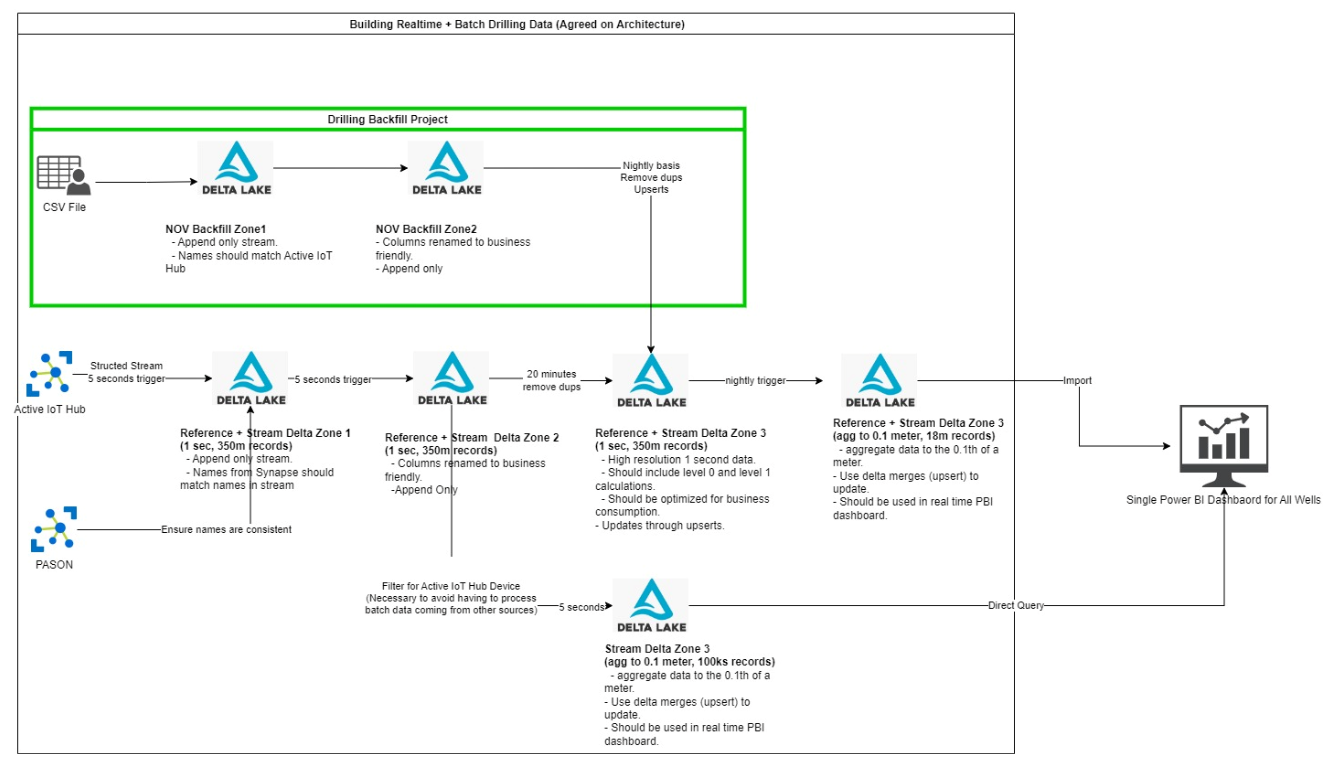
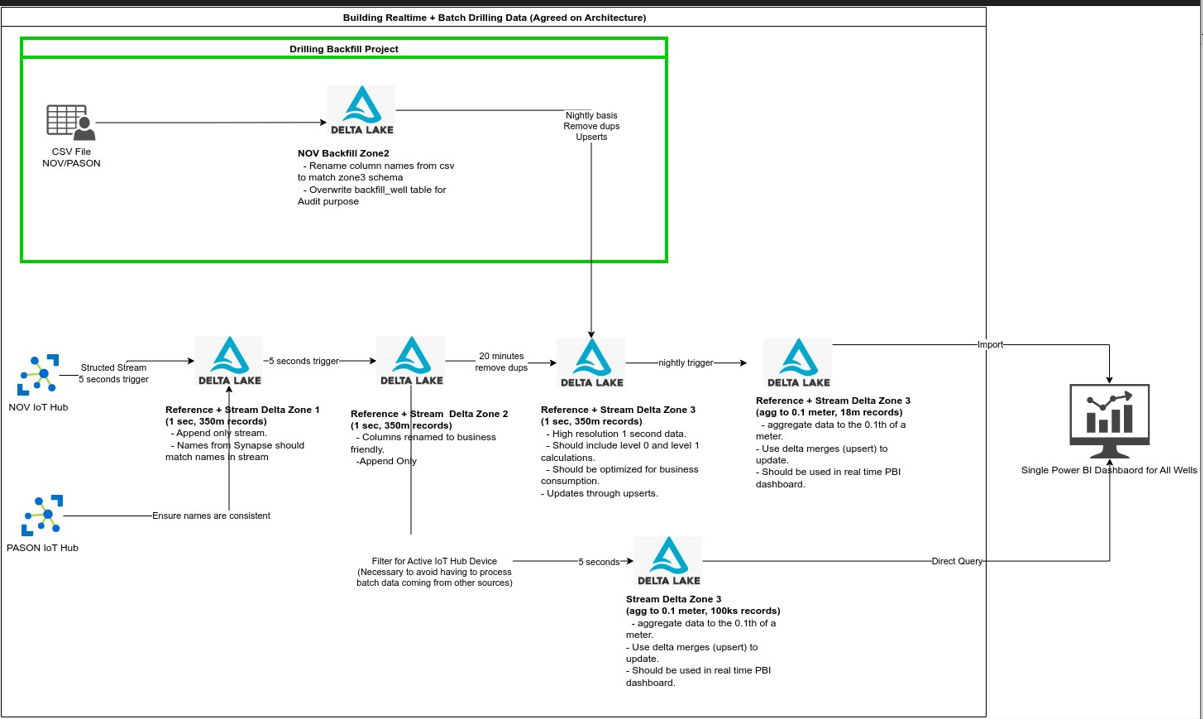
High Level Data Flow – NOV and PASON Streaming
Streaming Data Flow
- Data lands in Zone 1 every 5s as JSON (~70 columns), converted and appended to the Zone 1 Delta table.
- PASON data schema matches the existing schema; torque conversion is applied before processing.
- Column names are changed to business-friendly in Zone 2 Delta table.
- Data from Zone 2 is processed into Zone 3 data in two branches:
- Active Well Branch: Aggregates “On Bottom” drilling data from 1s (time) to 0.1m (depth), adds calculations, upserts to Zone 3 stream table for Power BI dashboard. Triggered every 5s.
- Reference Well Branch: Adds calculations to 1s data, upserts to Zone 3 reference well Delta table every 20 minutes, aggregates to 0.1m depth for dashboard reference.
- Backfilling mechanism allows engineers to backfill EDR data from historical wells (from welldata.ca or Pason datahub) into the drilling data. Files must follow a naming convention and are processed nightly.
Architecture
Figure: Architecture diagram of the Drilling Database, from ingestion to internal process.
PASON and NOV Streaming Schema
The data from Pason and NOV IoT hubs lands at ARC’s IoT hub as JSON messages (one per second per rig). The table below summarizes the expected schema and units for key fields.
| Field | Unit | NOV Example | PASON Example |
|---|---|---|---|
| ANN_PRESSURE | kPa | “ANN_PRESSURE”: 0 | “ANN_PRESSURE”: -999.25 |
| AVG_ROP_FT_HR | m/hr | “AVG_ROP_FT_HR”: 10.98972 | “AVG_ROP_FT_HR”: 0 |
| BIT_DEPTH | meters | “BIT_DEPTH”: 1839.792 | “BIT_DEPTH”: 30.48 |
| … | … | … | … |
For full schema, see the documentation or contact the project team.