WIPA Overview
Project Objective
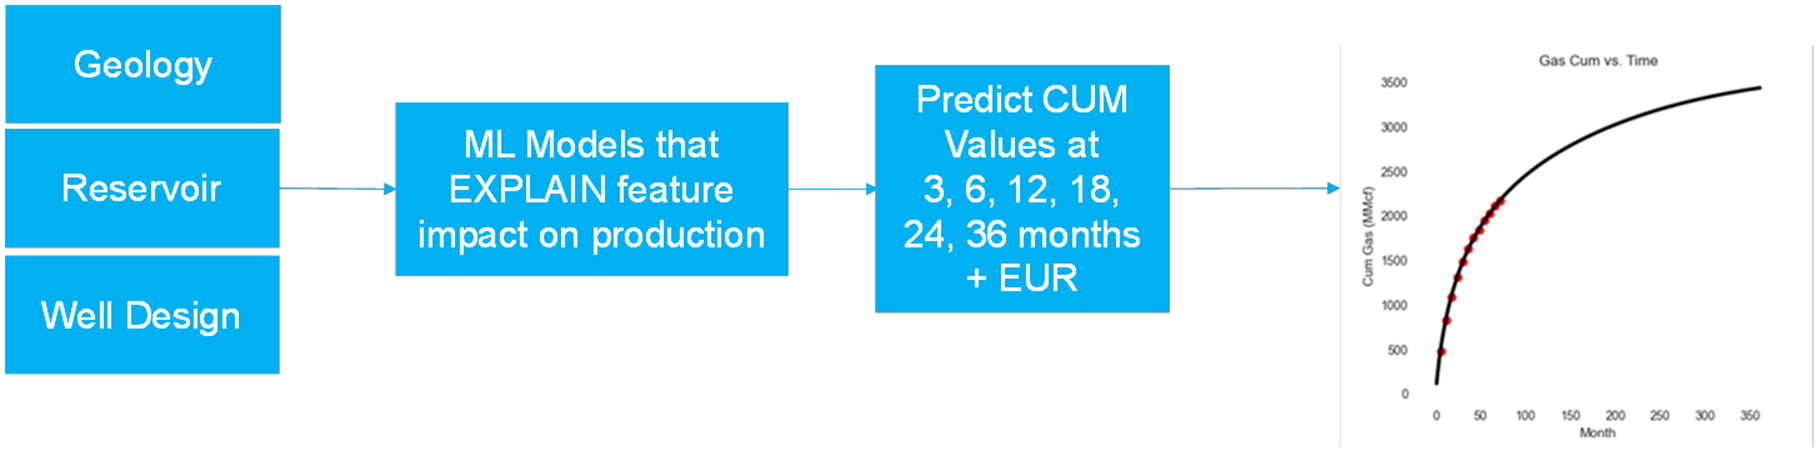
Project objective: Understand what influences (and predict) cumulative volumes at fixed points in time (3, 6, 12, 18, 24, 36 months + EUR).
Well Design features can be adjusted given the geological and reservoir features for a well (pad) placement: 0.1 – 0.5MM$ NPV per well impact.
Models will facilitate simulation of outcomes given a range of completion designs and the cumulative values at fixed intervals will be converted to a curve.
Production curve required to calculate well Net Present Value (NPV) for each well design. While well economics are out of scope of this project, optimizing well economics is the end goal (the most productive well may not be the most commercial well).
The model was deemed successful when the accuracy matched or exceeded ARC’s well forecasts at the time of Drill AFE from the 2018 to 2022. This created a benchmark of 25% absolute error for gas volumes and 35% absolute error for liquid models.
Applications
The Volumes Regression Model will be key in the following applications:
Well Design Optimization
- Review planned well design – compare AFE / LTP Type Curves vs ML Predicted Volumes
- Identify key drivers in improved well performance (cl/stg x cl‑m x t/cl
m3/t – m3/min
Well Spacing & LL‑m) - Evaluate opportunities for improved well performance / economics and resource recovery
Well Planning and Future Development
- Develop type curves for regions with limited data
- Evaluate LTP (Long Term Plan) of assets
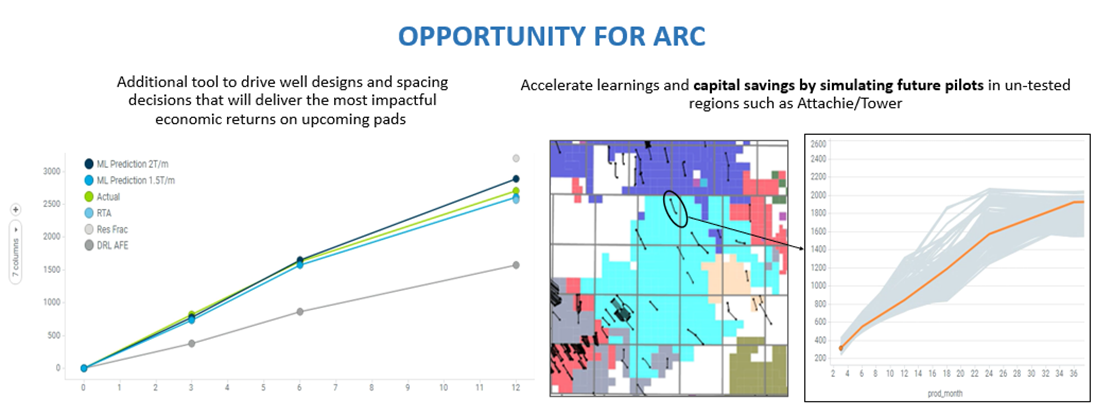
- Identify future potential in un‑delineated regions (ie. Attachie/Tower) & formulate pilot strategy for success
Corporate Strategy and Business Development
- Identify synergies in acquiring under‑developed and/or unoptimized Montney assets
- Generate optimal designs across Montney fairway and rank operators/assets by well performance / economics / resource recovery
- Rank Montney operators with remaining best future economic inventory. Compare to existing well economics to date.
Location
Tables of Data Used in Training: prd_zone3.wipa
- geo_canonical_regional_attributes_bronze
- well_dimensions_bronze
- well_production_volumes_bronze
- well_spacing_depletion_features_bronze
- geology_reservoir_features
- volume_features
- well_design_features
- well_detail_features
Tables of Model Results: prd_zone3.wipa
- volume_prediction
- volume_metrics
- volume_shap_values
- volume_regression_scenario_dim
- volume_regression_scenario_fact
- volume_regression_scenario_prediction
- volume_regression_model_input
Repo:
ARCRes/ARC Data Analytics Team/Repos/Files/Completions Machine Learning/volume_analytics
Databricks Workspace:
- Production: arcprdbrcksmlprototypes
- UAT: arcuatbrcksmlprototypes
- DEV: arcdevbrcksmlprototypes
Security
Security in WIPA is comprising of two parts first one is of the product level and the second one is at the Model’s predictions level. The first part describes who has what level of access to the model. The second one is at the database level where model predictions are stored. Databricks Unity Catalog Row Level Security (RLS) is implemented to provide the row‑level access based on users membership to the Azure Active Directory (AAD) group. Details can be found in the subpage – WIPA RLS.
The below groups currently have access to the results of the model:
| Level 1 | Level 2 | Level 3 | Role |
|---|---|---|---|
| Development | Engineering & Geosciences | Engineering | role.Engineering |
| Development | Engineering & Geosciences | Geosciences | role.Geosciences |
| Development | Land & Business Development | role.BusinessDevelopment | |
| Development | Planning & New Ventures | role.StrategicPlanning | |
| Operations | Operations Planning | Production Engineering | role.Production.EngineersField, role.Production.Engineers |
| Operations | Capital Operations | Data Analytics | role.IMT.IS.BusinessIntelligence |
| Operations | Capital Operations | Completions | role.Operations.Completions |
| Operations | Capital Operations | Drilling | role.DrillingAndCompletions |
If you would like access please reach out to
panderson@arcresources.com or
JCampbell@arcresources.com
WIPA RLS
Overview of RLS in WIPA
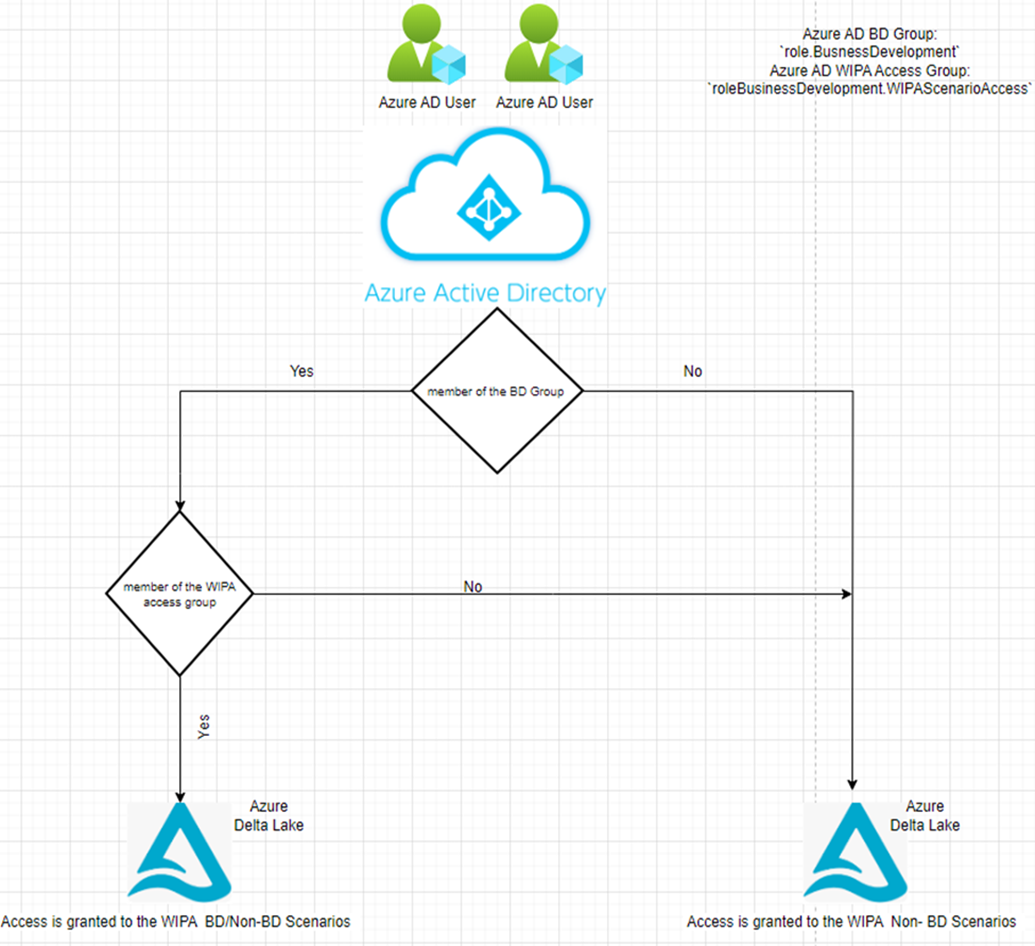
Row‑Level Security (RLS) in WIPA is a feature that allows for fine‑grained data access control over WIPA Volume Regression tables based on user’s roles and membership in Azure Active Directory (AAD) groups.
Purpose of RLS Implementation
The primary purpose of implementing RLS is to ensure that business development users can access WIPA data relevant to their role and responsibilities within ARC. This enhances data security and privacy.
Access Control Using AAD Groups
Explanation of AD Groups
Azure Active Directory (AAD) groups are used to organize and manage users within the ARC’s domain. These groups are leveraged in Databricks Unity Catalog to control access to specific tables and data.
Mapping AD Groups to Databricks Unity Catalog Access
Azure AD group (role.BusinessDevelopment.WIPAScenarioAccess) is mapped to specific Business Development users in Databricks Unity Catalog. This mapping determines the level of access a user has to different tables and data.
RLS Implementation Overview
How RLS Restricts Data Access
RLS restricts data access based on the user’s role and membership in AD group (role.BusinessDevelopment.WIPAScenarioAccess). This means that users who are members of this group and also members of the role.BusinessDevelopment group have full access to the data in WIPA Volume Regression tables and non-members cannot see their data but, they can see the data generated for their own scenarios.
Impact on Query Results Based on AD Group Membership
The membership of a user in different AD groups directly influences the results of their queries. Users will only see data associated with the groups they belong to.
User Guidelines
How to Access Data in WIPA Volume Regression Tables
User will login into the respective Delta Lake tables either using Azure Databricks workspace or can initiate queries using any Delta Lake client like TIBCO Spotfire using their profile or using their assigned username and password.
Row Level Security has been implemented on the following WIPA volume regression tables:
Catalog.wipa.volume_regression_model_inputCatalog.wipa.volume_regression_scenario_factCatalog.wipa.volume_regression_scenario_dimCatalog.wipa.volume_regression_scenario_prediction
Catalog could be any one of:
dev_zone3uat_zone3prd_zone3
Access behavior:
a. Based on their membership to the AAD Groups role.BusinessDevelopment and role.BusinessDevelopment.WIPAScenarioAccess their access is determined.
b. Business development users who have created/run the scenarios in WIPA and who are also members of the role.BusinessDevelopment.WIPAScenarioAccess have access to all data in the tables.
c. Non-Business development users who have created/run scenarios have access to their data/scenarios only. They cannot see the data generated by the BD team.
Troubleshooting Access Issues
If you are having issues accessing the data in above mentioned tables, here are the steps you can take to troubleshoot issues.
For BD Team
- Make sure you have proper access to WIPA Volume Regression tables mentioned above in this document. If you don’t have access, contact the appropriate support team.
- If you are a member of the BD team, ensure you are also a member of the AAD group
role.BusinessDevelopment. If not, please ask your leader to include you. - To access data generated for your WIPA scenarios, you must also be a member of the AAD group
role.BusinessDevelopment.WIPAScenarioAccess. If not, please talk to your leader to be included.
For Non‑BD Members
- Make sure you have proper access to WIPA Volume Regression tables mentioned in this document. If you don’t have access, contact the appropriate support team.
- Non‑BD members can access the data generated for their own WIPA scenarios only.
Contact Information
Details for Support and Assistance
In case you experience any issues accessing data in the above‑mentioned WIPA tables due to RLS, please contact the Data Analytics team.
Glossary
- RLS: Row level security
- AAD: Azure Active Directory
- WIPA: Well Insights Performance Advisor
- BD: Business Development
Data Sources
Well Analytics
prd_zone3.wellanalytics.dim__wellprd_zone3.wellanalytics.canonical__well_spacing_depletion_featuresprd_zone3.wellanalytics.fact__productionvolumesprd_zone3.wellanalytics.fact__productionvolumesdaysonprd_zone3.wellanalytics.fact__productionvolumesforecastcumulativeprd_zone3.wellanalytics.fact__productionvolumesforecastsummary
Geo Analytics
prd_zone3.geoanalytics.canonical__regional_attributes
gDC
prd_zone2.gdc.gsl_well_frac_stage
Success Criteria
The WIPA model must satisfy two criteria to be considered successful:
- Outperform POC models completed in 2021
- Outperform ARC Engineers’ type curve predictions at the time of drill approval
Target Error Thresholds
| Model Type | MAPE Target |
|---|---|
| Gas–Gas | 25% |
| Gas–Liquid | 25% |
| Liquid–Liquid | 35% |
Previous Model POC
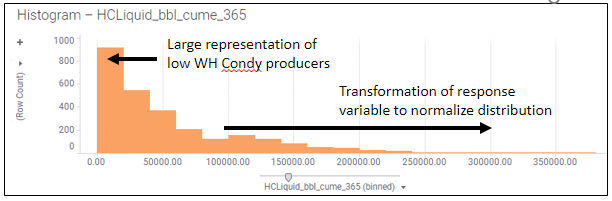
Log2 12‑Month Cumulative & EUR HC Liquids
In 2021, an LGBM model was created to predict Log2 of 12‑month cumulative and EUR hydrocarbon liquids (~2500 wells).
- 12‑month cum: R² = 0.83, MAPE = 4.5%
- EUR: R² = 0.79
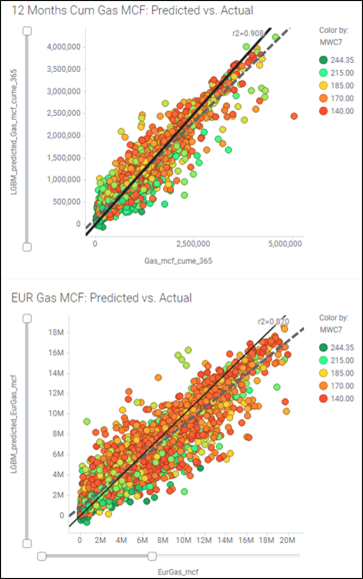
12‑Month Cumulative & EUR Gas
- 12‑month cum: R² = 0.74, MAPE = 38%
- EUR: R² = 0.65, MAPE = 106%
ARC Engineer Error
ARC currently provides production predictions of how wells will preform at the time of approval to drill the well.
Comparing these predictions to actual results will give a baseline for the model to achieve to provide value to ARC’s development team
In order to avoid issues with operation issues days where no production occurred will be removed. This is consistent with the data that will be used for model training.
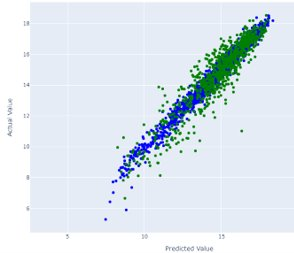
We can then compare the absolute percent error at each monthly data point.
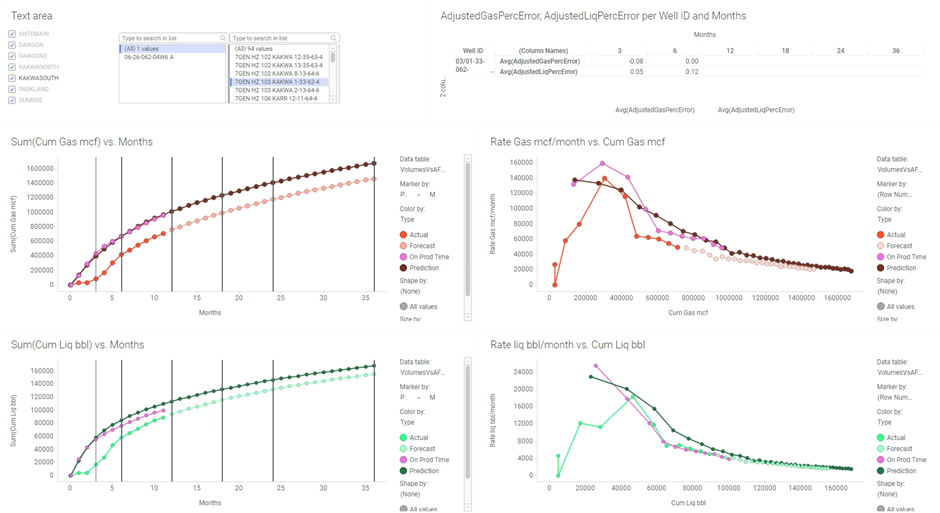
Below is an example of an ARC well with the: • Initial prediction in dark red for gas and dark green for liquids • Actual production in red for gas and green for liquids • Time adjusted to only on production days in magenta The top right table shows the percentage error for each point of interest
ARC Engineer Error by Time Interval
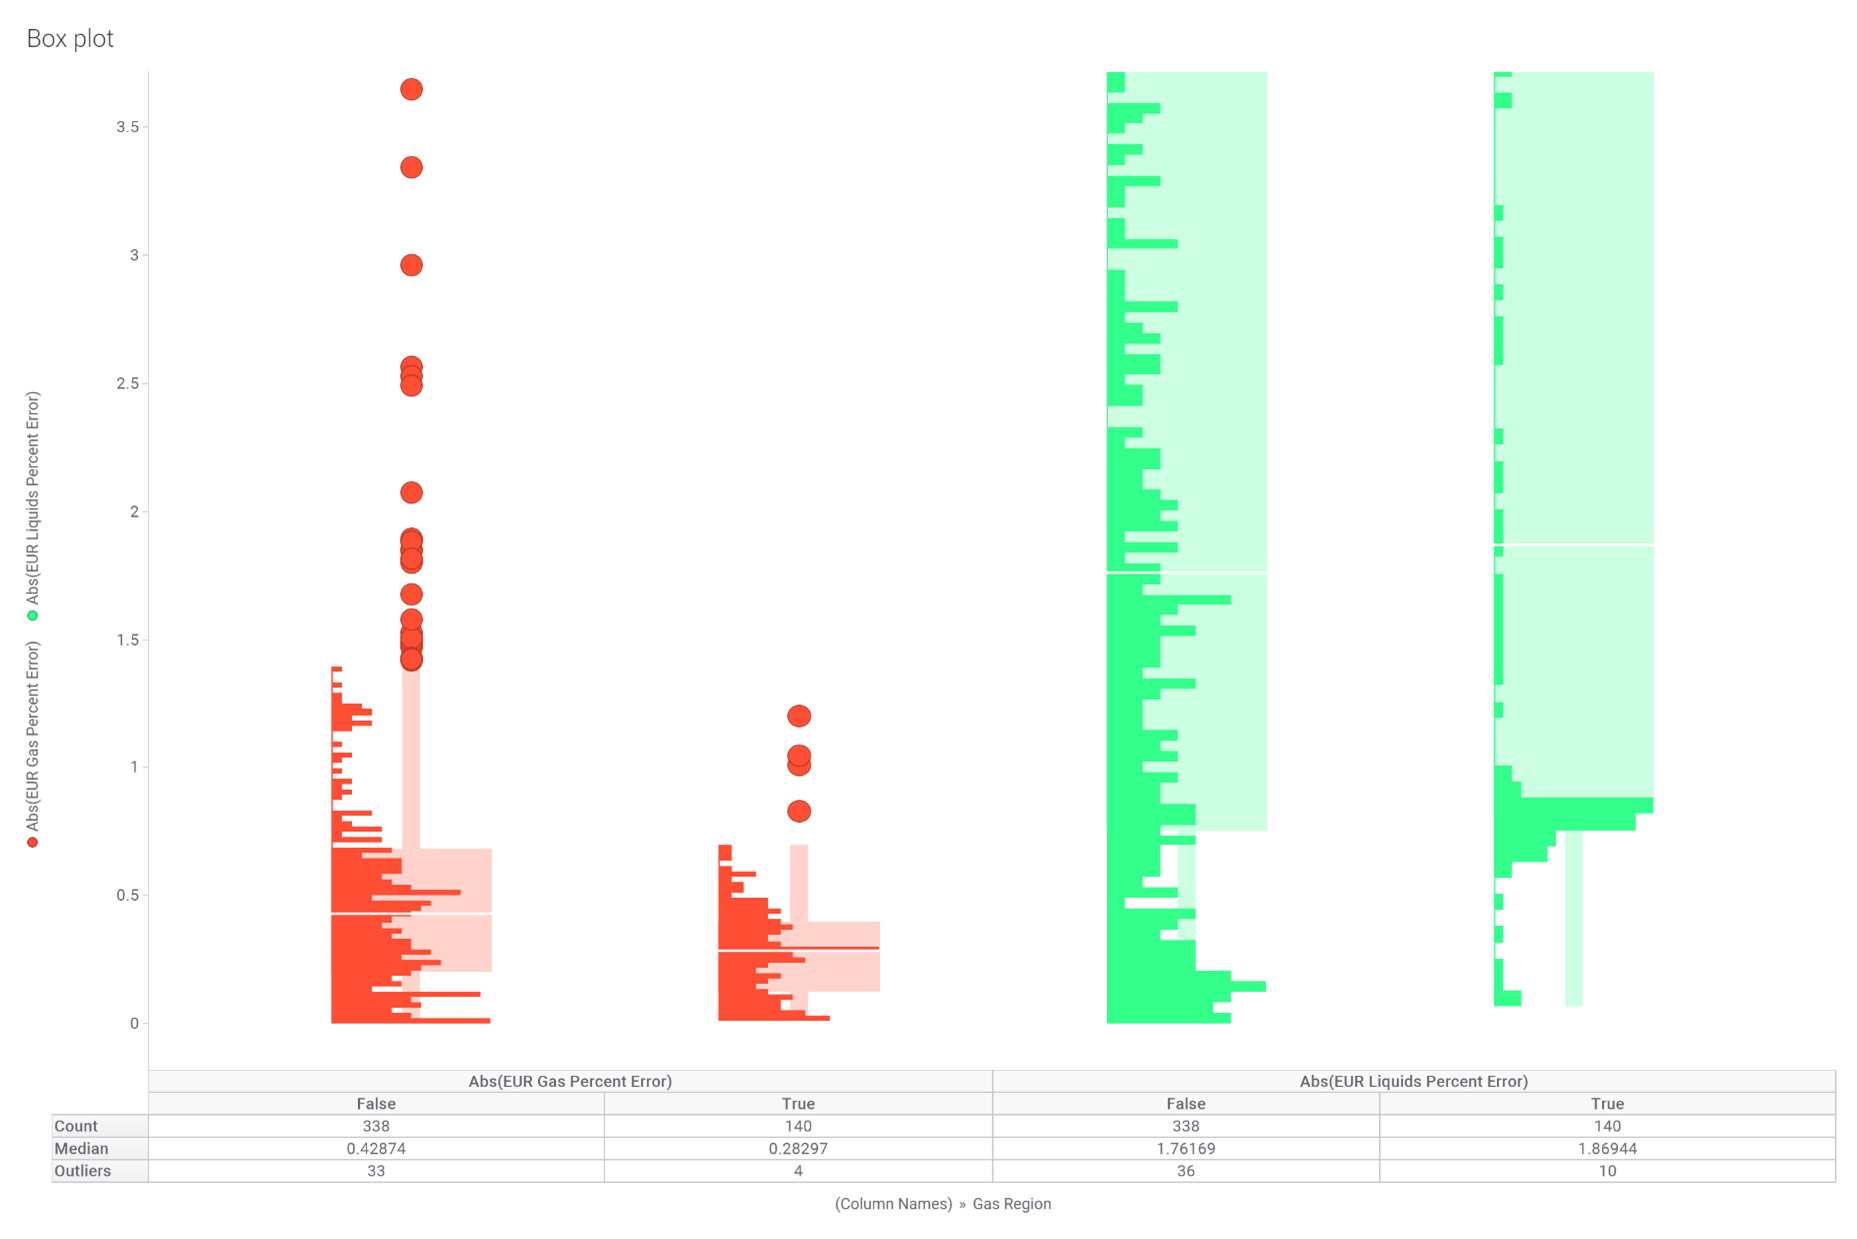
Below is a breakdown of observed error at each month for gas and liquids.
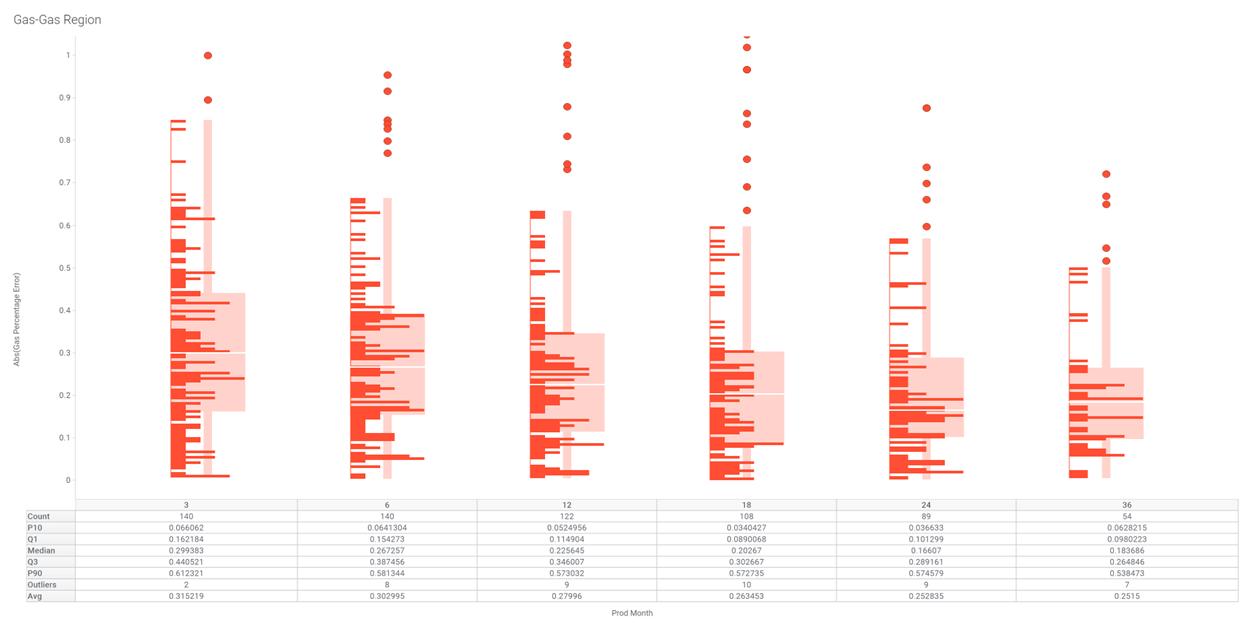
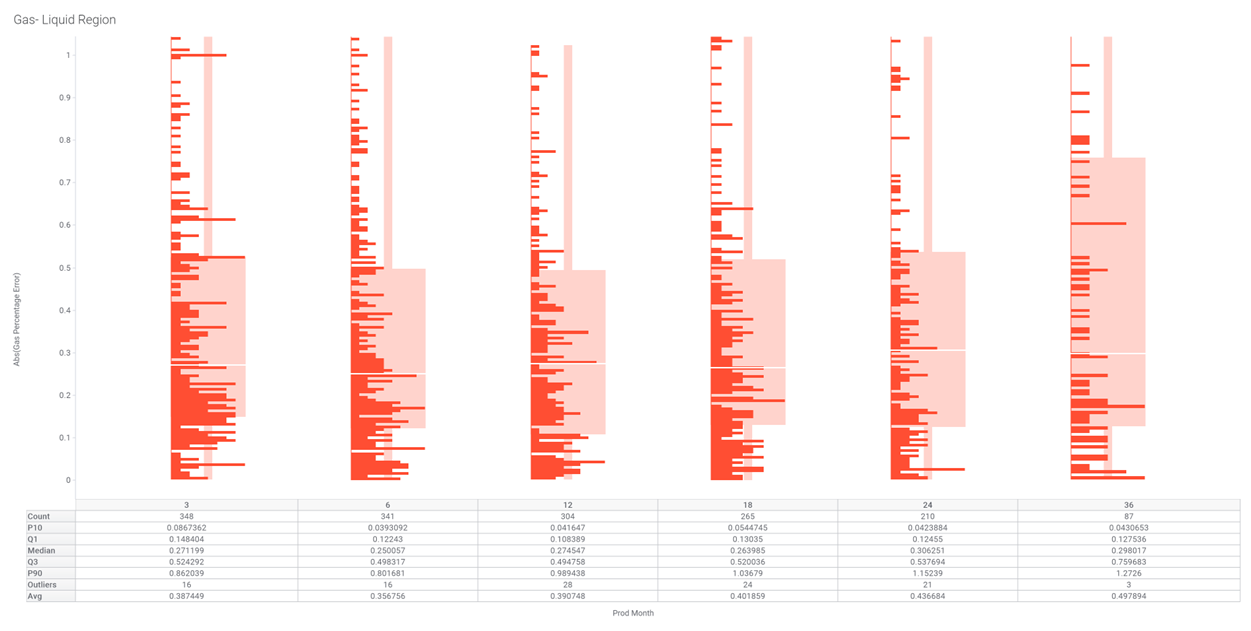
Notes on gas volumes predictions in liquid region: Our gas predictions errors in the liquid region remain consistent over the life of the well.
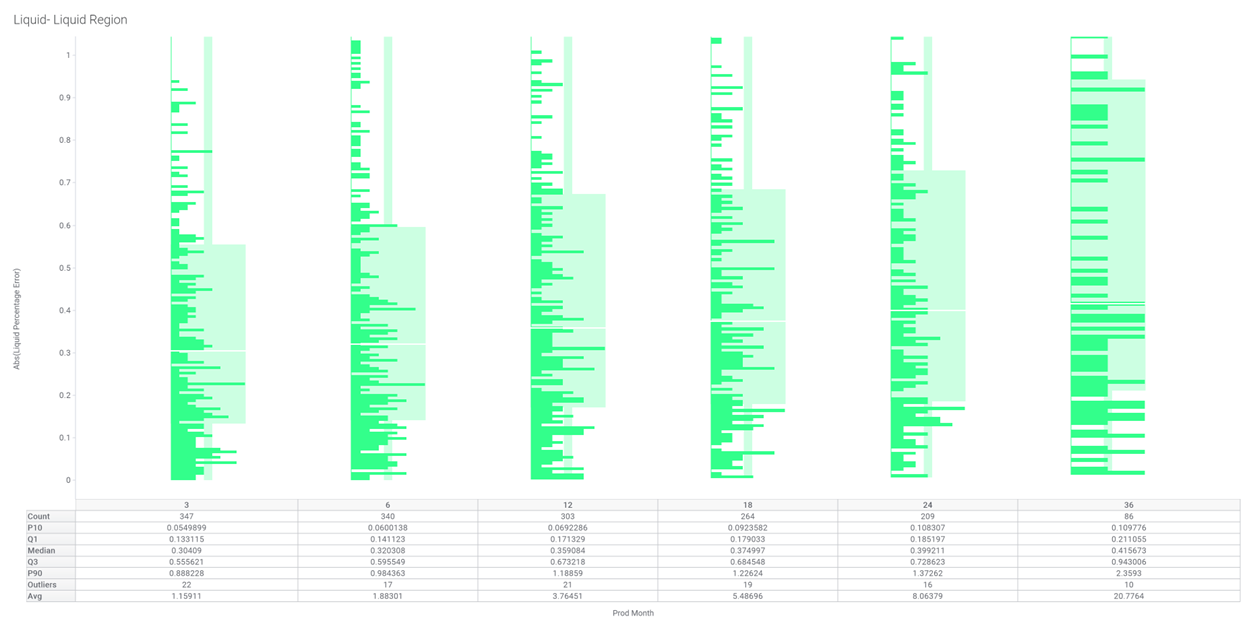
Notes on volumes predictions: Our error increases until 12 months and then begins to flatten out. This remains consistent when limiting to wells that have produced the entire period.

More documentation
Further documentation can be found here